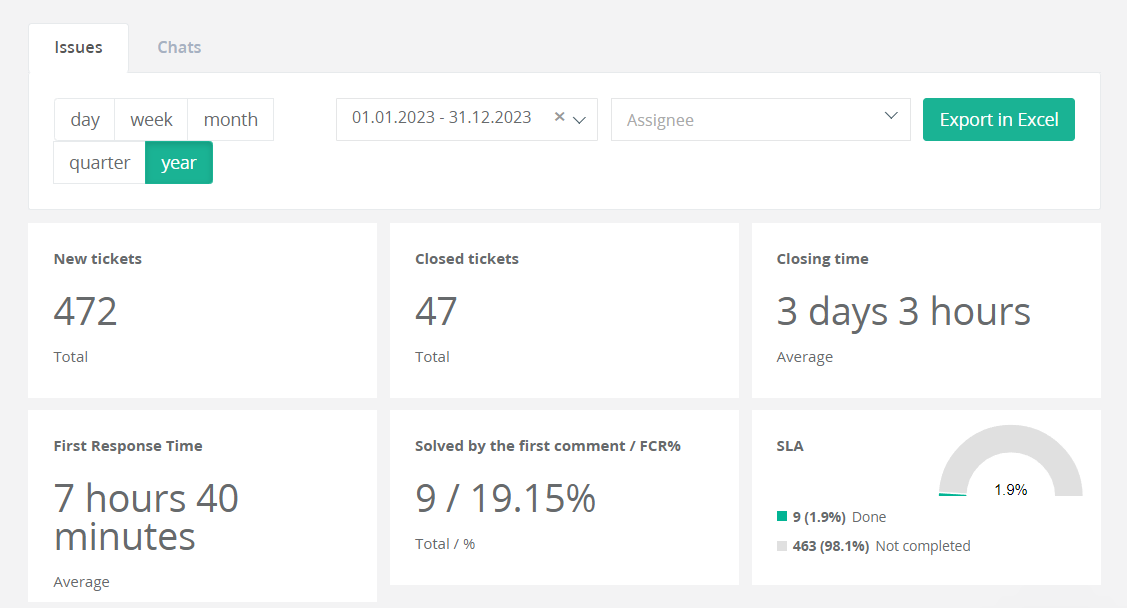
We have added a new chart to the dashboard. Additionally, we have introduced a separate report called ‘SLA Report’. This report helps track how operators comply with Service Level Agreement (SLA) requirements.
On the dashboard, users select the desired period and see two indicators. The first one, ‘Completed’, shows the percentage of requests that were closed on time. This means that these requests have successfully met the SLA requirements set when configuring the SLA counters. The second indicator, ‘Overdue’, shows the percentage of requests that agents failed to close on time.
On the dashboard, users select the desired period and see two indicators. The first one, ‘Completed’, shows the percentage of requests that were closed on time. This means that these requests have successfully met the SLA requirements set when configuring the SLA counters. The second indicator, ‘Overdue’, shows the percentage of requests that agents failed to close on time.

The SLA report, located in the corresponding settings section, is displayed as a detailed table with data. It contains details on each agent’s performance for each SLA indicator.


